👀 계량경제학 개인 공부용 포스트 글 입니다.
Ch1. Introduction and Motivation
① Econometrics is a quantitative and statistical analysis of economics. Statistical methods are used to analysis information in economic data.
▸ Econometric analysis : Estimation, Testing hypothesis
② Econometric model consists of a systematic part and a random error

▸unobservable errors, e
③ Types of Data
• Time series data : 일정 시간 간격으로 모은 데이터
• Cross-section form : 특정한 시간동안 관측하여 모은 데이터 (시간이 고정되어 있음 : ex. during 2012)
• Panel data : time series 데이터와 cross sectional 데이터의 결합
• Micro data vs Macro data
▸ Mcrio 미시 : data collected on individual (individuals, households, or firms) economic decision making
▸ Macro 거시 : data resulting from a pooling or aggregating over individuals (local, state, national levels)
• Quantitative or Qualitative
▸Quantitative : 정량적 (numbers)
▸Qualitative : 정성적 (Characters)
④ Statistical Inference
• Estimating economic parameters (ex. 탄력성 elasticities)
※ 경제학에서 탄력성이란 한 변수가 다른 변수에 의해 변동되는 정도를 뜻한다. 예를 들어, 가격탄력성은 가격의 변화에 따른 수요나 공급의 변화량을 뜻한다.
• Testing hypotheses
⭐ 계량경제학 키워드
• 단순 회귀 모형, Gauss Markov 정리
• 다중 회귀 모형 : 가설검정, 콥 더글라스 함수 검정, 우도비 검정
• 더미변수
• 다중공선성
• 이분산, 자기상관
• 연립방정식, 행렬연산
• 안정성, 시계열분해, 단위근 검정, 변동성 모형, VAR 모형, VECM 모형
• 고정효과, 변동효과
Ch2. Simple Linear Regression Model
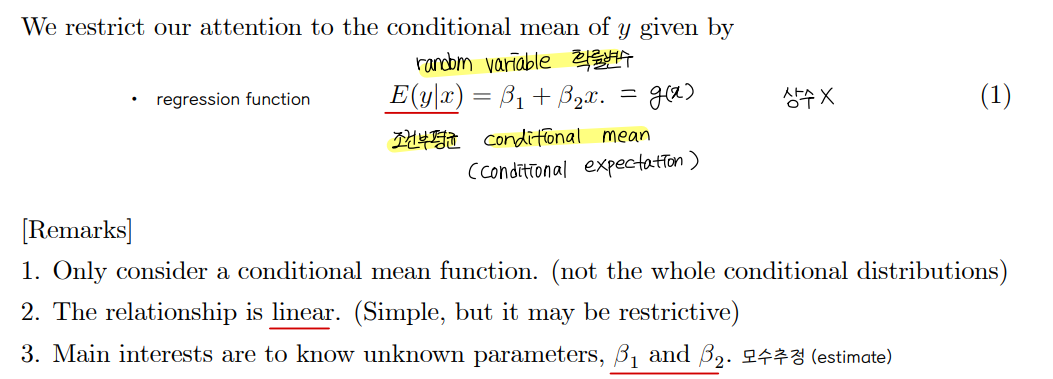
① Simple linear regression
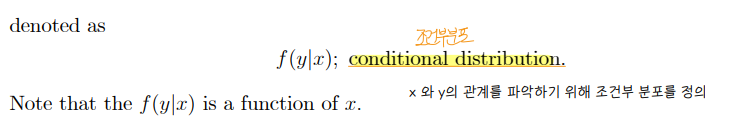
• Simple linear regression : 2개의 변수만 사용하는 회귀모델
▸ dependent variable , y
▸ regressor, x
▸ x 와 y 의 관계를 고려하기 위해, 조건부 분포를 살펴봄
• function
② Assumption
• The population regression line is linear
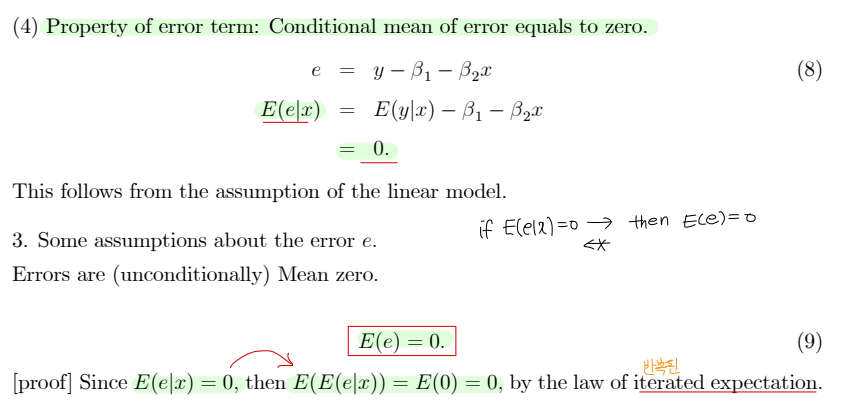
• Error term 에 대한 가정
a. Errors are Mean zero : E(e) = 0
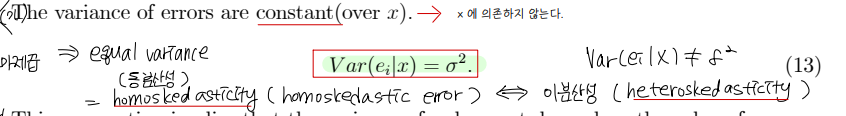
b. Equal Variance (or Homoskedasticity) : Var(e) = σ^2 , for all ei
c. Uncorrelatedness of errors : Cov(ei,ej) = 0
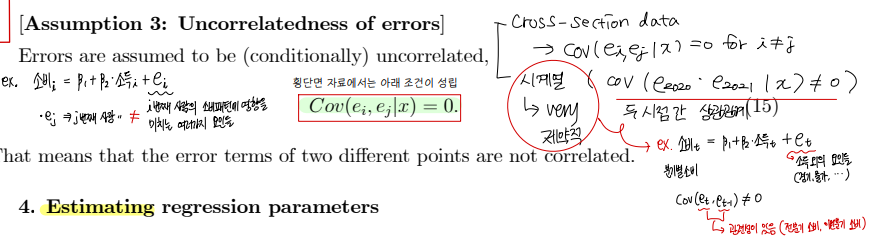
👉 가정1~3 을 만족한 상태에서의 회귀분석 : OLS (Ordinary Least Squares)
• OLS 추정량 → 통계량 statistics (데이터만의 함수) → 계산이 가능
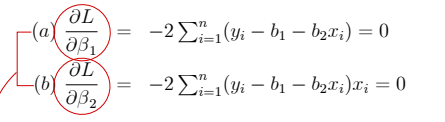
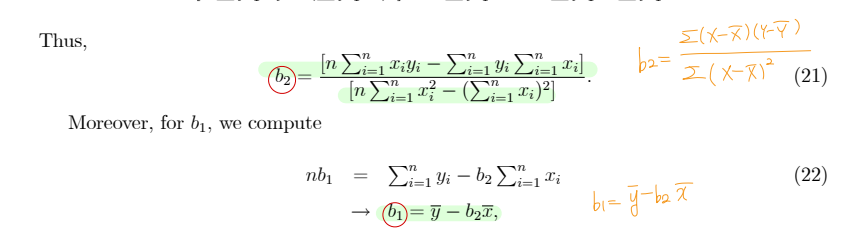
③ Estimating - loss function
• L2 norm : sum of squared error
• L1 norm : sum of absolute value of error
④ Properties of LS estimator
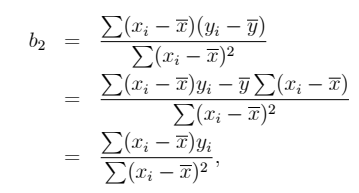
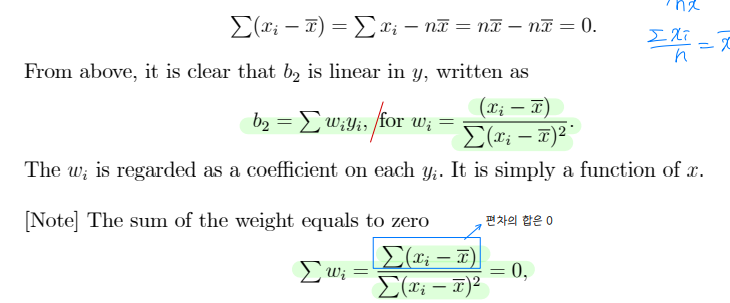
• b2 is linear estimator : Linear in y
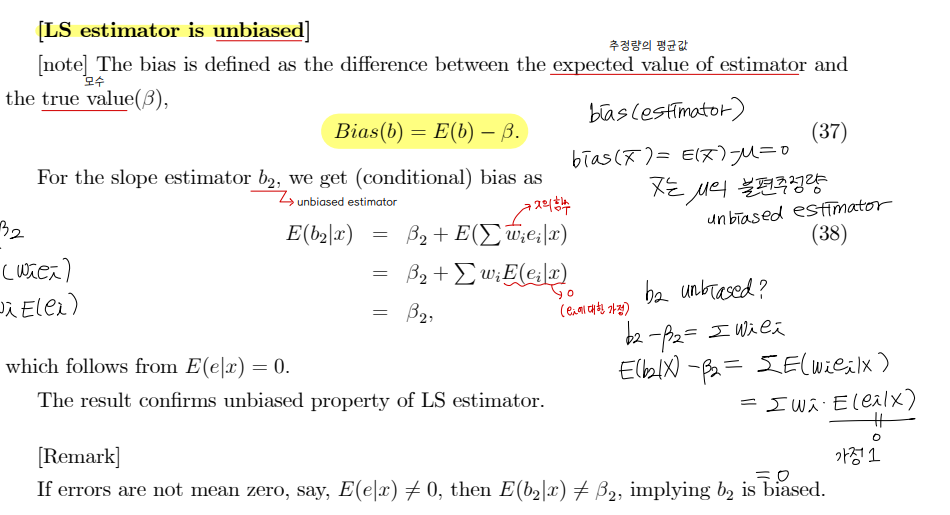
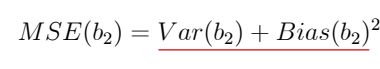
• LS estimator is unbiased : Bias(b) = E(b) - β = 0
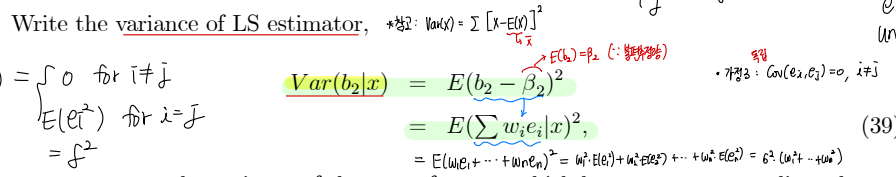
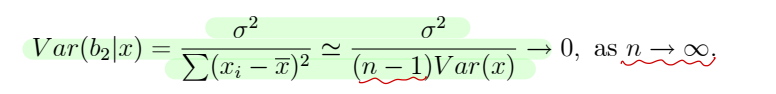
• Variance of LS estimator
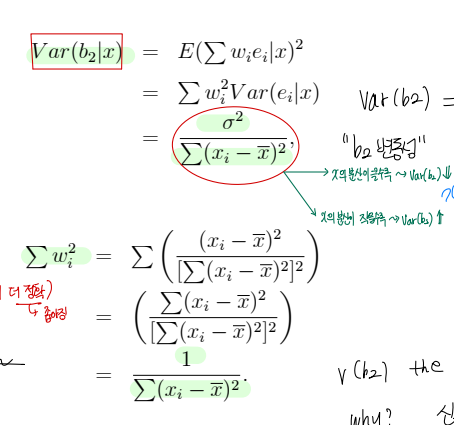
▸ Insight : var(b2) 수식을 살펴보면, 설명변수 X 변동성 (분모) 이 충분히 커야 var(b2) 가 낮아짐 (desirable : 신뢰구간이 좁아지며 더 정확해짐)
▸Consistency : 표본의 크기가 크다면, b2 (estimator) → β2 (parameter) 수렴한다. n 이 커질때 var(b) 가 0으로 간다면 consistency 를 만족한다고 볼 수 있다.
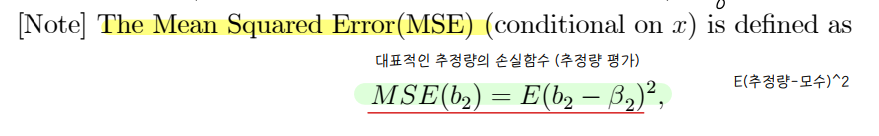
• MSE
⑤ Gaussian Markov Theorem
• Among a class of linear unbiased estimators, the LS estimator is the best linear unbiased estimator (BLUE)
• "Best" means that the estimator has the smallest variance among other estimators (b2의 분산이 가장 작은 것 in the set of linear unbiased set)
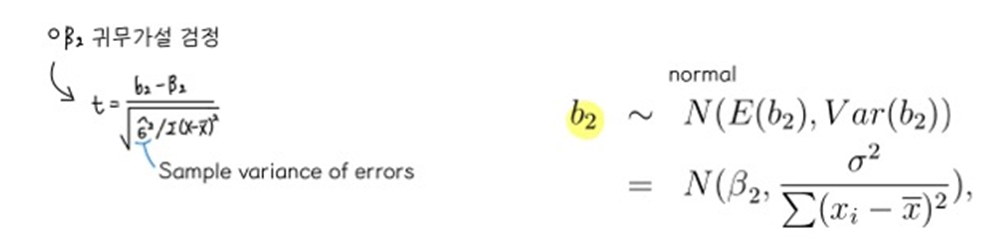
⑥ Distribution of OLS estimator
• Asymptotic Normality: under such assumptions, we can obtain normal distribution for the LS estimator
'1️⃣ AI•DS > ⚾ 계량경제•통계' 카테고리의 다른 글
| 계량경제학 스터디 CH7,8,9,10정리 (0) | 2023.03.31 |
|---|---|
| 계량경제학 스터디 CH3,4,5,6 정리 (0) | 2023.03.19 |
| Introduction to statistical learning - ch2 (0) | 2022.08.02 |
| Mathematical Statistics with application : chapter 2 (0) | 2022.07.20 |
| Mathematical Statistics with application : chapter 1 (0) | 2022.07.18 |


댓글